Final publication date 06 May 2022
An Analysis on the Effect of Crime Prevention CCTV by Local Government
Abstract
This study analyzed the reduction in five major crimes (murder, robbery, theft, violence, and sexual violence) owing to the effects of crime prevention CCTVs. The data used for the analysis were statistics of crime prevention CCTV data and five major crimes reported in local governments for 5 years (2015–2019). The effect was verified by correlation analysis and variance analysis method.
According to the analysis results, first, the reduction effect differed for each type of crime. This was high in the order of violence < robbery < five major crimes < theft. However, the result of sexual violence was not significant.
Second, the reduction effect differed depending on the number of the crime prevention CCTVs. Based on the number of crime prevention CCTVs per 10,000 population, the effective reduction rate was observed to be 36 units for theft and 60 units for the five major crimes/robbery/violence. Indeed, the effect might vary depending on the appropriateness of the installation site, such as a crime-prone area.
This study is meaningful as the first study to analyze the effect of crime prevention CCTVs using the data of the entire country. The results of this study are expected to be utilized by local governments when establishing policies to prevent crimes and improve local safety indices by installing crime prevention CCTVs.
Keywords:
Crime, Crime Prevention CCTV Effect, Local Government, ANOVA, Regional Safety Index키워드:
범죄, 방범용 CCTV 효과, 자치단체, 분산분석, 지역안전지수Ⅰ. Introduction
1. Research background and purposes
Crimes are among the most threatening to the safety of society. According to a 2020 survey by Statistics Korea, only 26.8% of the general public said that they felt safe and protected from crimes. Against this backdrop, various measures have been proposed and employed by different entities for the prevention and reduction of crimes. Among these measures are CCTVs installed for crime prevention.
In Korea, the idea of installing CCTVs for crime prevention was first proposed in 2002 by the Gangnam Police Station to be installed and operated in the Gangnam-gu area (Lee, M., 2004). Since then, local governments have been actively installing them in their jurisdiction for crime prevention, leading to an exponential increase in the use of CCTV (Cho, I. and Lee, J., 2012). With the number of CCTVs being reflected in the Crime Prevention Index1) under the Regional Safety Index, local governments are now more actively engaging in the installation of CCTVs for crime prevention. The Regional Safety Index is one of the policy measures implemented by the Ministry of the Interior and Safety to make sure that local governments continue to pay attention and make various efforts to ensure the safety of their residents. Since 2015, this program has required the safety level of each City/do and si/gun/gu to be diagnosed and publicly announced in accordance with Article 66-10 (Public Announcement of Safety Index) of the Framework Act on the Management of Disasters and Safety, thereby causing a significant impact on the safety management policy of the local governments (Shin, J. et al., 2016; 2021).
In response, local governments are now installing, or planning to install, more and more CCTVs for both crime prevention and an improvement in the Regional Safety Index. However, given that criminal acts are often impulsive or accidental, it still needs to be verified whether the increased number of CCTVs installed effectively contributes to crime prevention in a steady manner (Lim, M. and Hong, J., 2008). To this end, in the present study, the effect of installing CCTVs for crime prevention is analyzed in depth with respect to each crime type. These results are expected to serve as a useful guide for each local government when estimating the appropriate number of CCTVs for crime prevention and how many CCTVs should be additionally installed depending on the crime type.
2. Research scope and method
In the present study, data regarding the CCTVs for crime prevention installed and operated by the si/gun/gu governments nationwide for the past five years (2015 to 2019), as well as the number of five major crimes committed for the same period, were analyzed. Here, the five major crime types include murder, robbery, rape/indecent assault (hereinafter referred to as “sexual violence”), theft, and violence. These crimes are reflected in the determination of the performance index of the police (Police Science Institute, 2007), as well as the Regional Safety Index. Fraud and smishing scams were not included in the scope of the present study because CCTVs for crime prevention were considered to have only a limited effect on the prevention or reduction of crimes.
The analysis process was conducted in the following three steps. First, the selected data were refined for improved reliability of analysis results. For example, outliers that may lead to biased interpretations, i.e., cases where the number of crimes or CCTVs installed is either extremely high or low (including local governments that failed to report all cases) were removed and excluded from the analysis. To be more specific, outliers were removed using the quartile2) method in which criteria for outliers were clearly established, and based on the criteria, given variables were then classified into four groups. Second, the selected data were verified, and analysis types were selected. Here, the effect of installed CCTVs on reducing five major crimes was examined to determine whether the two parameters were correlated. In fact, such a correlation has been verified using various methods in many previous studies; however, given that the selected data varied in terms of the subject and time of the analysis, correlation analysis was conducted to confirm the correlation. The selected variables for the correlation analysis included the number of CCTVs for crime prevention, the number of five major crimes, and the number of the respective crimes by crime type. These variables were further segmented into categories by si/gun/gu unit to reflect characteristics unique to particular local governments. Only those that were confirmed through this analysis to have a correlation with the reduction of five major crimes resulting from the installation of CCTVs for crime prevention were subjected to further analysis. In addition, changes in the correlation coefficient before and after removing outliers using the quartile method were examined. Third, the effect of the installation of CCTVs for crime prevention was determined. Those that were confirmed to be significant in the correlation analysis were subject to further analysis using ANOVA. To this end, the local governments of interest were required to be classified according to the number of CCTVs installed for crime prevention. In an attempt to ensure consistency in analysis, the four groups previously used to remove outliers in the quartile analysis were used. Analysis types that were confirmed to provide a significant difference in the ANOVA process were subjected to post-hoc analysis to verify the significance of the correlation between each group. Based on the post-hoc analysis results, a unit decrease in the number of five major crimes per the number of CCTVs installed for crime prevention was determined to assess their effect on crime reduction.
The selected data were converted, considering the number of residents of the respective local governments for the corresponding year, into indexes per 10,000 residents for the analysis. By doing so, these data were made compatible with the Local Safety Level Index for the convenience of the local governments. Statistical processing and analysis were performed using Excel 2016 and SPSS 27.
Ⅱ. Literature Review and Current Status of CCTVs for Crime Prevention
1. Literature review
Crime prevention efforts have been made in earnest since the 2000s, when the Crime Prevention Through Environmental Design (CPTED) project was first implemented, mainly driven by the government and local government agencies, and this trend is still on the rise (Cho, Y.J. et al., 2019). The CPTED project the following five basic principles: ① Natural surveillance, ② Natural access control, ③ Territorial reinforcement, ④ Activity activation, and ⑤ Maintenance (Seoul Metropolitan City, 2013). Among them, natural surveillance and natural access control are mainly achieved by installing nighttime lighting and CCTVs for crime prevention. These measures are effective, especially in preventing trespassing crimes (theft, etc.) and reducing criminal impulses (Son, D. et al., 2020a). According to the results of the 2018 CPTED project implemented by the National Police Agency, lighting improvement and the installation of CCTVs for crime prevention were among the most widely applied measures (Korean National Police Agency, 2019). Although major motives may vary by crime type (whether the crime is accidental or deliberate, or is caused by economic or psychological factors, etc.), the presence of CCTVs for crime prevention contributes to increasing the psychological stability of residents, and thus the measure is often considered to be a high-priority strategy (Kim, S. et al., 2021). As such, CCTVs have thus far been put in place as a top priority measure to prevent crimes by most local governments, and therefore the effectiveness of the measure must be verified in a continuous manner.
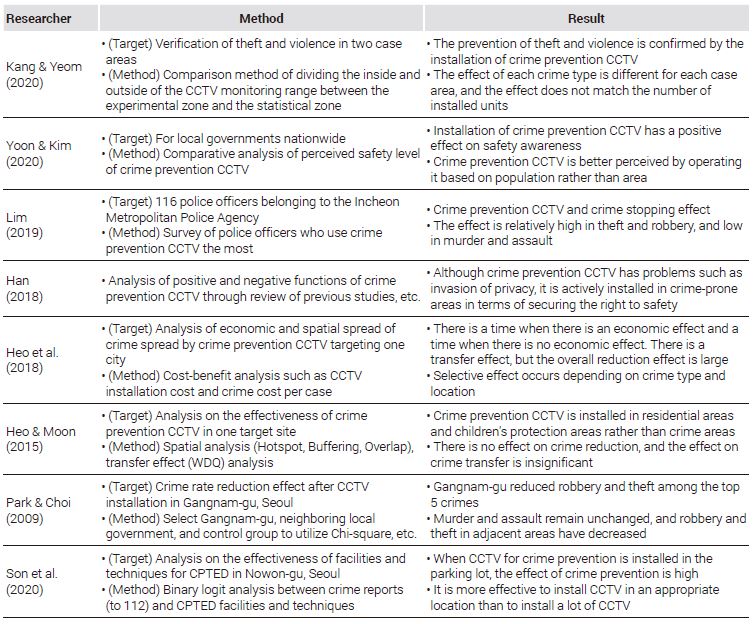
Research on the effect of CCTVs installed for crime prevention has been conducted in various forms, as follows: an analysis based on changes in the crime rate before and after the Gangnam-gu project; spatial analysis focused on spatial monitoring conducted by CCTVs for crime prevention; analysis of economic effects, privacy invasion, and crime displacement effects; and surveys on the level of effectiveness perceived by residents. Most of these studies determined that the installation of CCTVs contributed to reducing the number of five major crimes committed, but the effects varied depending on the crime type. Park, C. and Choi, S. (2009) assessed the effectiveness of the 2002 Gangnam-gu project, an early-stage project implemented by a local government entity to use CCTVs for crime prevention, using chi-square tests on the correlation between the area of interest and the control group. The researchers concluded that the measure led to a significant decrease in the number of robbery and theft cases committed, among the five major crime types. Lim, H. (2019) conducted a survey of police officers, who most frequently used CCTVs for crime prevention, on how effective the measure was. The results showed that the installation of CCTVs contributed to crime prevention and suppression and was found to be more effective in reducing theft and robbery cases than other types of crimes. Han, J. (2018) conducted a literature review on the pros and cons of the installation of CCTVs for crime prevention. This study highlighted the need to establish an institutional foundation enabling CCTVs to be installed as required, especially in areas vulnerable to crimes, so that the safety of residents could be ensured even though this approach involved some disadvantages, such as privacy invasion.
The installation of additional CCTVs has been one of the major strategies to prevent crimes. Given the limited budget allocated to these projects, however, this approach focused on increasing the number of CCTVs does not constitute a fundamental solution to this problem (Seoul Metropolitan City, 2013). It is equally or even more important to ensure that an appropriate number of CCTVs are installed in appropriate areas so that their effectiveness can be maximized. Kang, Y. and Yeom, Y. (2020) conducted case studies to examine the effect of the installation of CCTVs on reducing theft and violence cases. The researchers concluded that their effectiveness varied depending on the area of interest and crime type, and the higher number of CCTVs installed for crime prevention did not necessarily lead to a greater reduction in the crime rate. Heo, S. and Moon, T. (2015) employed spatial analysis to assess the effect of CCTVs on crime prevention. The researchers concluded that the effect of the CCTVs of interest on crime prevention and displacement was insignificant because they were installed in inappropriate locations. Heo, S. et al. (2018) reported that the CCTVs installed for crime prevention contributed to crime reduction and displacement while providing some economic benefits, but the degree of effectiveness varied depending on the crime type and area of interest. Son, D. (2020b) confirmed that the effectiveness of CCTVs for crime prevention was more affected by where they were installed than how many of them were installed in the entire building. CCTVs were found to be more effective during both day and night times when they were installed inside parking lots. Yoon, W. and Kim, J. (2020) reported that the presence of CCTVs for crime prevention contributed to improving the perceived level of safety by residents, highlighting the need to ensure that the required number of CCTVs installed should be determined based on the number of affected people rather than on the affected area. Choi, E. and Kim. Y. (2007) concluded that the installation of CCTVs was more effective in preventing property crimes such as robbery rather than accidental crimes such as murder or assault.
The major findings of the literature review are as follows. First, most of the studies confirmed the contribution of CCTVs installed for crime prevention to crime prevention and reduction as an effective deterrent against crimes. Second, their effectiveness varied depending on the crime type, but they were found to be mostly effective in preventing deliberate crimes, such as robbery and theft. Third, the installation of CCTVs for crime prevention may lead to crime displacement in which crimes move to another area without CCTVs. With this effort, however, the overall crime rate is expected to decrease. Fourth, the level of safety perceived by residents against crimes can be improved by increasing the number of CCTVs installed per population. However, it was also reported that the reduction in the crime rate was not necessarily proportional to the number of CCTVs installed (See Table 1). Fifth, the installation of CCTVs may have no, or an insignificant, effect on crime prevention unless they are installed in appropriate areas.

Prior research on the effect analysis of crime prevention CCTV
Likewise, the installation of CCTVs has proven highly effective as a top-priority strategy for crime prevention. However, most of these studies were case studies, in which the unique characteristics of each region were reflected in the analysis. No studies have thus far reported the effect of CCTVs installed for crime prevention that has been verified at the national level. Some studies used nationwide data regarding the perceived level of safety by residents, to be sure, but the direct effect of CCTVs on the actual crime rates was not examined in these studies. The present study is unique in that the actual effect of CCTVs installed on crime prevention was assessed using nationwide data.
2. Characteristics of used data and current status
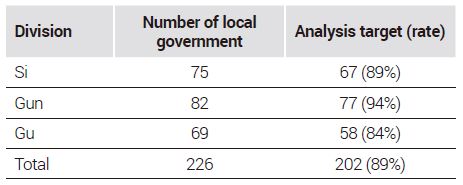
The Ministry of the Interior and Safety3) looks into the current status of CCTVs installed and operated in public institutions on an annual basis and requires local governments to report on them in accordance with Article 25 (Limitation to Installation and Operation of Visual Data Processing Devices) of the Personal Information Protection Act. In the present study, CCTVs that were installed by local governments in public areas for crime prevention were analyzed. Among the 226 local governments nationwide, only 202 were subjected to analysis, excluding those that had failed to report data in the past five years (2015-2019) (See Table 2). Data regarding the number of five major crimes committed for the same period were obtained from the National Police Agency.
An analysis target of local government
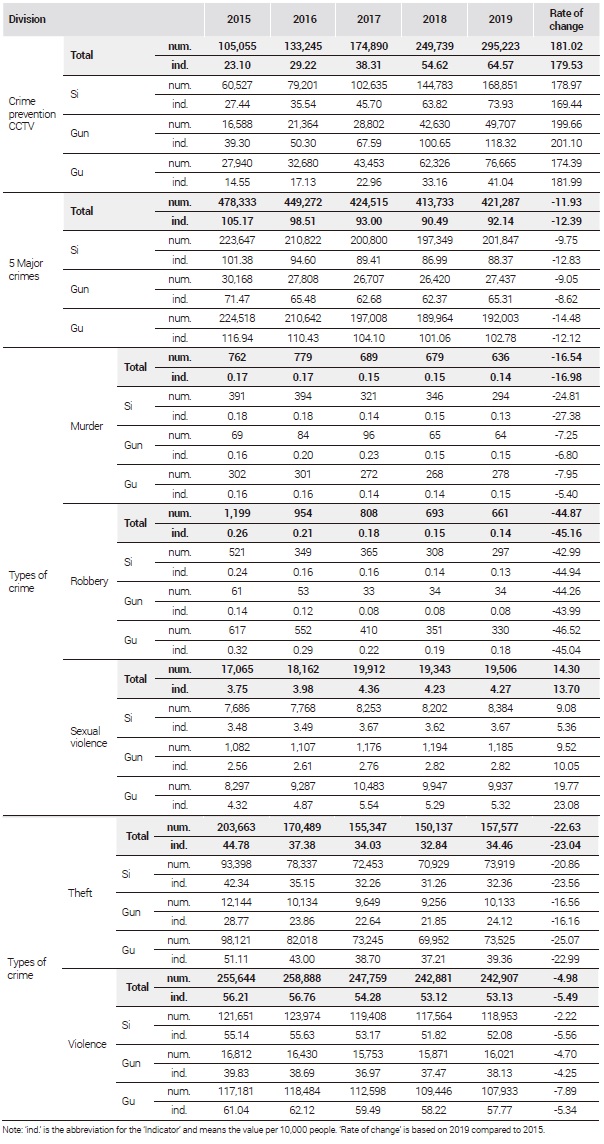
The total number of CCTVs installed and operated for crime prevention in the areas of interest increased to 295,223 as of 2019, an 181% increase from the 2015 level (See Figure 1 and Table 3). Despite variations by year, the number continued to increase over time, and the year 2018 saw the greatest increase by 42.8% from the 2017 level. The number of five major crimes committed also decreased to 421,287 as of 2019, an 11.9% decrease from the 2015 level. However, the degree of reduction started to decrease in 2018, and in 2019, the number even increased by 1.8% from the previous year's level (See Figure 1). These results suggested that an increase in the number of CCTVs installed for crime prevention did not necessarily lead to a reduction in the number of five major crimes committed. This statistical interpretation was also consistent with the result of a previous study by Kang, Y. and Yeom, Y. (2020) that the presence of more CCTVs installed did not guarantee that crimes could be more effectively prevented.

A trend of crime prevention CCTV and 5 major crimes
Crime prevention CCTV and 5 major crimes in the last 5 years
Variations in the number of CCTVs installed and five major crimes committed by si/gun/gu unit were summarized and compared, as shown in Table 3. For comparison, all data by si/gun/gu unit for each year were converted into standardized indexes, i.e., numbers per 10,000 residents. The rate of increase in the number of CCTVs installed for crime prevention increased in the order of si (169.44%) < gu(181.99%) < gun (201.10%). The rate of decrease in the number of five major crimes committed increased in the order of gun (8.62%) < gu (12.12%) < si (12.83%). However, the order of the increasing rate in the number of CCTVs installed for crime prevention did not coincide with the order of the decreasing rate in the number of five major crimes committed. The number of CCTVs installed for crime prevention per 10,000 residents for 2019 increased in the order of gu (41.04 units) < si (73.93 units) < gun (118.32 units). In contrast, the number of five major crimes committed per 10,000 residents for the same year increased in the order of gun (65.31) < si (88.37) < gu (102.78). These results indicated that the number of crimes committed was smaller in areas where more CCTVs for crime prevention were installed.
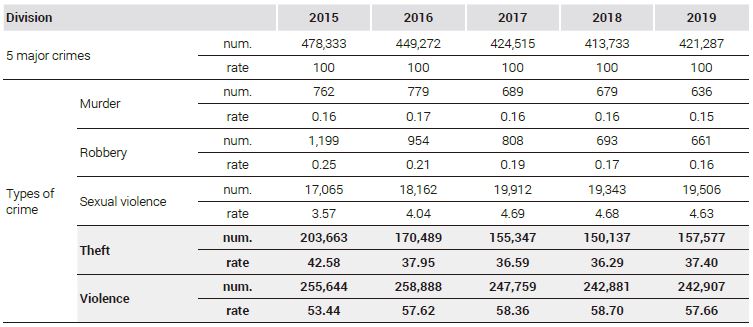
The total number of five major crimes committed decreased by 12.39% in 2019 compared to the 2015 level. Among different crime types, sexual violence cases increased by 13.70% despite some variations from one si, gun, or gu to another. The degree of decrease was the largest in robbery cases, followed by theft (23.04%), murder (16.98%), and violence (5.49%). In fact, the degree of reduction varied between each si, gun, or gu. Theft and violence cases accounted for 95% or more of the five major crimes committed for the period. The rate of decrease in the number of violence cases was lower than that of the five major crimes at 12.39%, and thus their proportion in the total number of five major crimes committed increased from 53.44% in 2015 to 57.66% in 2019. In contrast, the figure decreased from 42.58% down to 37.40% for theft cases (See Table 4).
Number and rate of types of 5 major crimes
Overall, an increase in the number of CCTVs installed for crime prevention was not directly translated into a reduction in the number of five major crimes committed. In addition, the increasing or decreasing patterns found in the number of crimes committed varied depending on the crime type and among each si, gun, or gu. A simple and intuitive interpretation of these statistical data indicated that the use of CCTVs may be more effective in crime prevention when installed in areas where theft or robbery cases were relatively frequent than in areas where violence cases were frequent among the five major crime types. Accordingly, it is necessary to determine and analyze the correlation between the number of CCTVs installed for prevention by region and the resultant changes in the number of five major crimes by crime type.
Ⅲ. Analysis of Correlation between CCTVs for Crime Prevention and the Number of Crimes by Crime type and Region
1. Removal of outliers from data subject to analysis
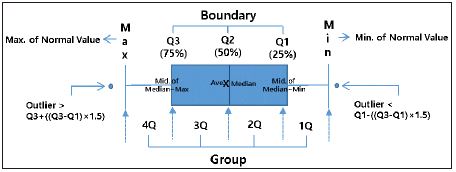
Based on the data collected from the local governments of interest for the past five years, a scatter plot was prepared (See Figure 2). In the plot, some outliers were found along both axes of the number of five major crimes committed and the number of CCTVs installed for crime prevention. It was necessary to remove these outliers using the quartile method for improved reliability of analysis results. In the quartile method, the criteria for outliers are given as equations, and thus outliers can be easily removed without being influenced by the subjective opinions of the analyzer. Besides, this method allows the subjects of interest to be classified into four groups, and thus there is no need to separately form groups for the subsequent ANOVA process.

Scatter plot of analysis targets (local governments) before outlier removal
In the quartile analysis, given data points are sorted according to their value and classified into four groups with 25%, 50% (median value), and 75% as the thresholds. In the present study, given data points were classified as follows: 1Q for 25% or less, 2Q for 25-50%, 3Q for 50-75%, and 4Q for over 75%. Box-and whisker graphs were plotted using the quartile analysis results, as shown in Figure 3. Data points exceeding the maximum value of the 4Q group were regarded as outliers (colored with green and pink). With these outliers removed, a scatter plot was drawn again, as shown in Figure 4. The R2 value of the trend line for the plot increased from 0.0915 (with the outliers included, as shown in Figure 2) to 0.1257 after removing the outliers, as shown in Figure 4. In social science, when the coefficient of determination (R2) is at a level of 0.13, the corresponding factor is typically deemed to have an intermediate level of influence (Cohen, J., 1988). In this light, the removal of outliers was considered to have improved the reliability of analysis results.

Box-and-whisker graph using quartiles

Scatter plot of analysis target (local governments) after outlier removal
2. Analysis of the correlation between CCTVs for crime prevention and the number of crimes by crime type and region
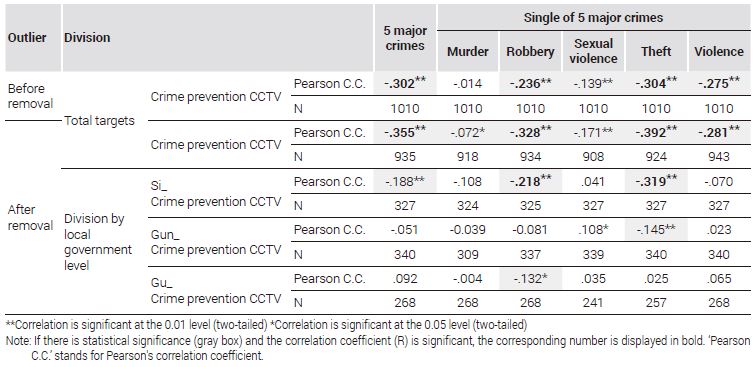
Correlation analysis was performed to determine the type of ANOVA to use, and the results are presented in Table 5. The analysis was conducted on the selected data regarding the CCTVs installed for crime prevention and five major crimes committed both before and after removing the outliers. More detailed analysis at the si, gun, or gu level was conducted only on those with the outliers removed.
Correlation analysis results before and after outlier removal
The analysis results showed that the number of CCTVs installed for crime prevention exhibited a negative (−) correlation with the number of five major crimes committed, regardless of whether the outliers were removed. This result can be simply interpreted as follows. In areas where there are more CCTVs installed for crime prevention, the number of five major crimes committed is relatively smaller. This correlation does not account for any causal relationship, to be sure, but when combined with the results of previous studies, this interpretation implies that the installation of CCTVs for crime prevention may have a significant effect on reducing five major crimes.
After removing the outliers, the correlation coefficient for the five major crime types improved from -.302 to -.355. The coefficient for robbery cases improved from -.236 to -.328. However, given that the correlation coefficient (R) should be at least 0.2 to be considered statistically significant (those of 0.2 or less are thus ignored, Chae, D., 2005), the correlation between the number of CCTVs for crime prevention and the reduction in the number of crimes committed was only statistically significant for the robbery, theft, and violence cases. When analyzed at the si, gun, and gu level, a statistically significant correlation was found only in the robbery and theft cases at the si level.
Only the cases in which the correlation of interest was confirmed to be significant through the correlation analysis were further subjected to the ANOVA process to determine the effect of the number of CCTVs installed on crime prevention.
Ⅳ. Effect and Characteristics of CCTVs Installed for Crime Prevention
1. ANOVA results
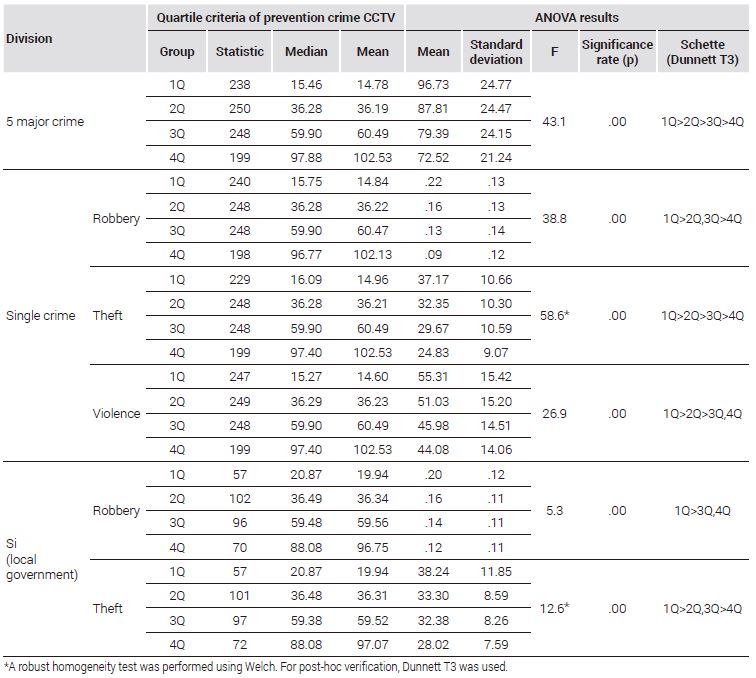
As a result of the correlation analysis, “Five major crime cases,” “Robbery cases,” “Theft cases,” “Violence cases,” “Robber cases at the si level,” and “Theft cases at the si level” were confirmed to be statistically significant with a correlation coefficient (R) of over 0.2. In the ANOVA process, variances were divided into equal and unequal variances to verify the homogeneity of variances. In the case of equal variances, only when the significance probability (p) was 0.05 or less as a result of ANOVA, indicating that the corresponding groups had a significant difference, a post-hoc verification was performed to confirm the difference between the groups. The post-hoc verification was conducted using Schutte’s method because each type involved different variables. In the case of unequal variances, however, the Welch verification was employed to determine whether the corresponding groups exhibited a significant difference (i.e., with a significance probability of 0.05 or less), and a post-hoc verification was further performed using the Dunnett T3 method. The analysis results are presented in Table 6. A significant difference between groups was found in six analysis types, including the five major crime type. The theft type as an unequal variance was subjected to a robust homogeneity test using the Welch method. A post-hoc verification was also performed to determine the significant difference between each group. In the five major crime type and the theft type, all four groups were found to have a significant difference from each other. In contrast, in the robbery type and the si-level theft type, a significant difference was found between the groups, except between 2Q and 3Q. In the violence type, a significant difference was found, except between 3Q and 4Q. In the si-level robbery type, a significant difference was only found between 1Q and 3Q/4Q.
Group criteria using quartiles and ANOVA results
2. Effect and the appropriate number of CCTVs installed for Crime Prevention
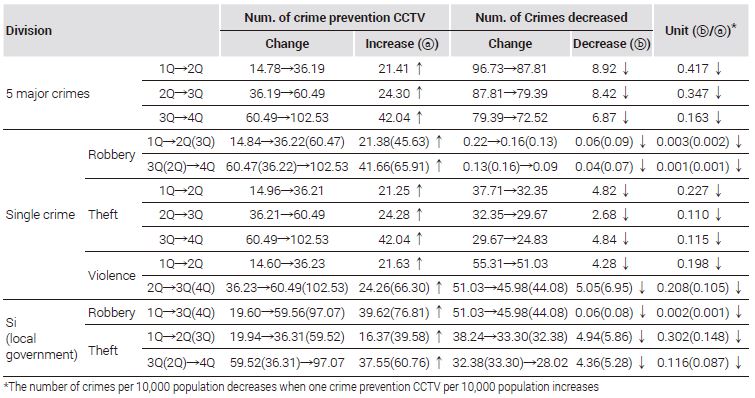
The ANOVA results showed that when the number of CCTVs installed for crime prevention exceeded a certain level, the number of crimes committed was lowered, despite some variations depending on the analysis type. In an attempt to have a more intuitive interpretation of these analysis results, the unit ratio of the decrease in the number of crimes by crime type to the increase in the number of CCTVs installed was estimated and presented in Table 7. The results showed that the installation of CCTVs for crime prevention resulted in a reduction in the number of crimes committed, but the degree of reduction varied depending on the number of existing CCTVs present in the area. In the case of the five major crime type, when the number of CCTVs installed per 10,000 residents increased by one, the number of crimes committed decreased by 0.417-0.163 on average, provided that the average number of existing CCTVs was at a certain level (1Q group, 14.78 units on average). Decreasing patterns observed in these results indicating the effect of CCTVs installed for crime prevention can be largely divided into three types.
Considering the significance between groups, the number of CCTV increased and the number of crimes decreased by unit
The first type is where the degree of reduction in the number of crimes decreased with the increasing number of CCTVs installed for crime prevention. A case in point is the five major crime type. As the number of CCTVs installed for crime prevention increased from 1Q (14.78) to 2Q (36.19), 2Q (36.19) to 3Q (60.49), and then 3Q (60.49) to 4Q (102.53), the number of crimes committed decreased by 0.417, 0.347, and 0.163, respectively; i.e., the degree of reduction decreased. A similar pattern was also found in the robbery type and the si-level theft type. The second type is where the degree of reduction in the number of crimes first decreased but then started to increase. This pattern was observed in the robbery type among the five major crime cases. In the theft type, as the number of CCTVs installed for crime prevention increased from 1Q to 2Q, 2Q to 3Q, and then 3Q to 4Q, the number of crimes committed decreased by 0.227, 0.110, and 0.115, respectively. Simply put, the degree of reduction was the smallest when the number of CCTVs increased from 2Q to 3Q. The third type is where the degree of reduction in the number of crimes first increased but then started to decrease. This pattern was observed in the violence type among the five major crime cases. In the violence type, as the number of CCTVs installed for crime prevention increased from 1Q to 2Q, 2Q to 3Q, and then 3Q to 4Q, the number of crimes committed decreased by 0.198, 0.208, and 0.105, respectively.
These reduction patterns were plotted for visualization, as shown in Figure 5. Overall, local governments who plan to install CCTVs for the reduction of five major crimes should consider the following two factors. First, in the case where violence and robbery cases are more frequent among the five major crime types, the installation of CCTVs within the range of the 3Q group is expected to be highly effective in crime prevention. Simply put, installing up to 60 units of CCTVs, corresponding to the average number of CCTVs per 10,000 residents of the 3Q group, is considered to be highly effective in crime reduction. However, as the number exceeds 60, their effectiveness may be degraded by more than half. Even though the reduction patterns varied depending on the crime type, i.e., the five major crime type or the violence type, this threshold was estimated by tracking the point where their effectiveness started to decrease sharply. Second, in the case where theft cases are more frequent, it is desired to install CCTVs within the range of the 2Q group. Installing up to about 36 units of CCTVs, corresponding to the average number of CCTVs per 10,000 residents of the 2Q group, is considered to be highly effective. However, exceeding the number may lead to degraded effectiveness. Here, it is worth noting that their effectiveness determined based on statistical data may vary depending on crime motives and characteristics unique to each region.

Types of crimes due to the increase crime prevention CCTV
The unit reduction from 1Q to 2Q in the si-level theft type was 0.302, larger than that of the overall theft type at 0.227. However, even though the average number of CCTVs installed for crime prevention increased from 36.31 (2Q) to 59.52 (3Q), the average number of theft cases committed changed from 33.30 to 32.38, not a statistically significant difference. However, the unit reduction from 3Q to 4Q in the si-level theft type was 0.116, larger than that of the overall theft type at 0.115. Thus, this correlation is worth considering in decision-making.
3. Summary of analysis results
The conduct of patrol and crime prevention activities by the police or citizens has been a convention measure of anticrime efforts. With the spatial and temporal limitations, combined with the transition into a bystander society, however, CCTVs for crime prevention have drawn significant attention as a promising alternative (Han, J., 2018). Many local governments have thus far installed CCTVs to ensure the safety of their residents against crimes. As of 2019, the number of CCTVs installed in the regions of interest of the present study was 295,223, an 181% increase from the 2015 level of 105,055. Meanwhile, it was encouraging that the number of five major crimes committed started to decrease in 2018; however, the number started to increase again, and the number of CCTV installed for crime prevention was still increasing accordingly. Since then, many previous case studies have discussed issues regarding the effect of CCTVs installed for crime prevention varying depending on the crime type or other factors. In the present study, nationwide data were first employed in the assessment of the effectiveness of CCTVs installed for crime prevention.
It was true that the number of five major crimes committed started to increase in 2018, but the total number of five major crimes committed in 2019 was about 12% smaller compared to the 2015 level. The number of robbery cases, in particular, decreased by about 45%, and the number of theft cases decreased by about 23%. Next, correlation analysis was conducted to determine how the number CCTVs installed for crime prevention was correlated with crime reduction. Among the cases that were confirmed to be statistically significant through analysis, the negative correlation coefficient between the number of CCTVs installed and the reduction in the number of crimes committed was found to increase in the order of violence < robbery < five major crimes < theft. These results showed that the effectiveness of CCTVs for crime prevention may vary depending on the crime type, and the installation of CCTVs could be relatively more effective in preventing theft cases. In fact, most previous studies reported that the use of CCTVs was effective in preventing theft, but their effect on violence cases differed from one study to another. The result of the present study is considered to be in line with these observations. Third, ANOVA was performed to examine the effect of the number of CCTVs installed on crime prevention by crime type. Installing up to about 60 units of CCTVs per 10,000 residents was considered to be highly effective in preventing the five major crime type and the violence type. In the case of the theft type, the installation of up to 36 units of CCTVs was relatively more effective. Even though the number was higher than this threshold, they remained still effective to a certain degree; but the effectiveness may be degraded by more than half. It was also found that different patterns were observed when the data were analyzed at the si level.
As suggested by a study by Heo, S. and Moon, T. (2015), the installation of CCTVs for crime prevention may fail to achieve the desired effect unless the unique characteristics of areas vulnerable to crimes are sufficiently considered. This also means that a significant effect can be expected if CCTVs are installed in appropriate areas while also considering the presence and characteristics of areas vulnerable to crimes, even if the number of CCTVs installed exceeds the optimum level.
Ⅴ. Conclusions
The major findings of the present study are as follows. Local governments who plan to additionally install CCTVs to protect their residents from crimes and improve their Local Safety Level Index should consider the following three factors.
First, the installation of CCTVs for crime prevention is certain to be effective in reducing five major crimes. However, their effectiveness may vary from one local government to another depending on the crime type, the number of existing CCTVs present in the area of interest, and whether they were installed in appropriate areas. Second, CCTVs installed for crime prevention may be more effective if the proportion of theft or robbery cases among the five major crime types is higher in the local government of interest than in others. However, if the proportion of sexual violence cases is higher, other measures should be considered. Third, if the proportion of theft cases remains still higher even if the number of CCTVs installed for crime prevention per 10,000 residents is larger than 60, it is necessary to check to see if the existing CCTVs have been installed in appropriate areas rather than considering the additional installation of new CCTVs.
In Korea, the number of CCTVs installed for crime prevention per 10,000 residents was 64.57 as of 2019, close to the threshold of 60, which falls in the range in which their effect on reducing five major crimes starts to sharply decrease. Their effectiveness may vary between each si, gun, or gu, and the average number of CCTVs installed also varies between each si, gun, or gu: 41 at the gu level and 118 at the gun level. However, the results of the present study are of significance in that the country is at a point where various considerations are required to ensure the appropriate use of CCTVs for crime prevention. However, the present study has limitations in that important factors, such as the characteristics of criminals by crime type and environmental and regional features and characteristics that may cause criminal behavior, could not be employed as research variables. Still, given that these criminological factors are reflected in the number of crimes committed, the attempt of the present study to verify the effectiveness of CCTVs installed for crime prevention using extensive nationwide statistical data is of great significance.
Based on these results, it is expected that the installation of CCTVs for crime prevention is considered to be one of the various measures to achieve crime prevention and reduction, rather than the one and only measure of excellence. In addition, the major findings of the present study may provide answers to the questions constantly asked by local governments regarding the effectiveness of CCTVs installed for crime prevention in an attempt to improve their Regional Safety Index. Further, the results of the present study are expected to be combined with various other analysis results regarding socioeconomic characteristics and environmental and psychological aspects that may cause criminal behavior so that they can be used to develop anticrime projects tailored to each region.
Acknowledgments
This research was funded by the National Disaster Management Research Institute’s R&D Support Program for Disaster and Safety Management Activities (technology for measuring the level of local safety awareness).
References
-
Chae, S.I., 2005. Social Science Research Methodology (3rd Edit.) , Seoul: Bnmbooks.
채서일, 2005. 「사회과학조사방법론 (3판)」, 서울: 비앤엠북스. -
Cho, I.H. and Lee, J.G., 2012. “Analysis of Factors Influencing Crime Prevention Policy Diffusion: Focusing on CCTV Diffusion of Local Governments in Seoul”, The Korea Association for Policy Studies, 21(2): 221-244.
조일형·이종구, 2012. “범죄예방정책의 확산 영향요인 분석: 서울시 기초자치단체의 방범용 CCTV 도입 확산을 중심으로”, 「한국정책학회보」, 21(2): 221-244. -
Cho, Y.J., Han, S.K., Hyeon, T.H., and Park, Y.N., 2019. A Study on the Effectiveness of CPTED Projects: Focused on Five Projects in Seoul, Architecture & Urban Research Institute.
조영진·한수경·현태환·박유나, 2019. 「범죄예방 환경조성사업의 효과성 분석 연구: 서울시 5개 CPTED 사업 지역을 중심으로」, 건축도시공간연구소. -
Choi, E.R. and Kim. Y.S., 2007. “The Effectiveness of the Closed Circuit TVs (CCTVs) on the Crime Prevention”, Korean Journal of Public Safety and Criminal Justice (KJPC) , 16(1): 143-186.
최응렬·김연수, 2007. “방범용 CCTV의 범죄예방효과에 관한 연구”, 「한국공안행정학회보」, 16(1): 143-186. - Cohen, J., 1988. Statistical Power Analysis for the Behavioral Sciences (2nd ed.), Hillsdale, NJ: Lawrence Erlbaum Associates.
-
Han, J.G., 2018. “A Study on Establishment and Management of the Crime Prevention CCTV”, Journal of Public Society, 8(4): 109-137.
[
https://doi.org/10.21286/jps.2018.11.8.4.109
]

한재경, 2018. “범죄예방용 CCTV의 설치 및 운영에 관한 소고”, 「공공사회연구」, 8(4): 109-137. -
Heo, S.Y. and Moon, T.H., 2015. “An Analysis on the CCTV Location Appropriateness and Effectiveness for the Crime Prevention”, Journal of the Korean Association of Regional Geographers, 21(4): 739-750.
허선영·문태현, 2015. “범죄예방을 위한 CCTV 위치 적절성 및 효과성 분석”, 「한국지역지리학회지」, 21(4): 739-750. -
Heo, S.Y., Moon, T.H., and Kim, J.Y., 2018. “Cost-Benefit and Spatial Effects of CCTV on Crime Prevention”, Journal of the Korean Association of Geographic Information Studies, 21(3): 63-75.
허선영·문태현·김주영, 2018. “방범용 CCTV 설치로 인한 경제적·공간적 효과분석”, 「한국지리정보학회지」, 21(3): 63-75. -
Kang, Y.G. and Yeom, Y.H., 2020. “A Study on the Crime Prevention Effectiveness of CCTV”, Journal of Community Safety and Security by Environmental Design, 11(2): 35-59.
[
https://doi.org/10.26470/JCSSED.2020.11.2.35
]
강용길·염윤호, 2020. “방범용 CCTV의 범죄예방효과에 관한 연구: 감시범위 및 운용기관별 효과성을 중심으로”, 「한국셉테드학회지」, 11(2): 35-59. -
Kim, S.H., Kim, K.Y., and Baek, T.K., 2021. “A Study on Urban Regeneration Considering the CPTED –Focusing on the Case Study of the Busan Ansim Village Project–”, Journal of the Korean Association of Geographic Information Studies, 24(1): 54-67.
김신혜·김광열·백태경, 2021. “셉테드(CPTED)를 이용한 도시재생방안에 관한 연구 –부산시 안심마을 조성사업 대상지를 중심으로–”, 「한국지리정보학회지」, 24(1): 54-67. -
Korean National Police Agency, 2019. “A Revitalization of Preventive Security focused on Community“, Paper presented at Conference of Korea CPTED Association, Incheon: Songdo Convensia, 54-67.
경찰청, 2019. “공동체 중심의 예방치안 활성화 방안”, 한국셉테드학회 –경찰청 공동 추계학술대회 자료집, 인천: 송도컨벤시아, 54-67. -
Lee, M.Y., 2004. “Legal Review of Cases of Prevention Crime CCTV”, International Telecommunications Policy, 16(16): 20-54.
이민영, 2004. “방범용 CCTV 운용사례에 대한 법적 검토”, 「정보통신정책」, 16(16): 20-54. -
Lim, H.J., 2019. “The Recognition of Detectives about the Crime Prevention Effects of Open-street CCTV”, The Korean Association of Police Science Review, 21(2): 151-174.
[
https://doi.org/10.24055/kaps.21.2.6
]
임형진, 2019. “방범용 CCTV의 범죄예방효과에 대한 수사경찰의 인식: 인천지방경찰청 소속 경찰관을 중심으로”, 「한국경찰학회보」, 21(2): 151-174. -
Lim, M.H. and Hong, J.H., 2008. “Directions of Crime Prevention Policy through the Analysis of Crime Prevention Effects of CCTV”, Korean Policy Science Review, 12(4): 77-101.
임민혁·홍준현, 2008. “방범용 CCTV의 범죄예방 효과분석을 통한 범죄예방정책의 방향”, 「한국정책과학학회보」, 12(4): 77-101. -
Park, C.H. and Choi, S.H., 2009. “Crime Prevention Effects of Publicity of CCTV Installation at Kang-Nam Gu, Seoul: The Effects of First News”, Korean Criminological Review, 20(3): 217-243.
박철현·최수형, 2009. “서울시 강남구의 CCTV 설치가 범죄예방에 미치는 효과: 첫 신문보도 시점을 중심으로”, 「형사정책연구」, 20(3): 217-243. -
Police Science Institute, 2007. Reviewing the Appropriation of Five Crimes as an Index of Policing Performance Index and Development of Alternative Indexes, Seoul.
치안정책연구소, 2007. 「치안성과지표로서 ‘5대범죄’ 적정성 검토 및 대체지표 개발」, 서울. -
Seoul Metropolitan Government, 2013. A Guideline for CPTED, Seoul.
서울특별시, 2013. 「범죄예방환경설계(CPTED) 가이드라인」, 서울. -
Shin, J.D., Lee, D.K., Won, J.Y., and Pak, S.Y., 2021. “Safety Consciousness Concept and Measuring Scope”, Journal of The Korean Society of Hazard Mitigation, 21(1): 93-100.
[
https://doi.org/10.9798/KOSHAM.2021.21.1.93
]
신진동·이동규·원진영·박소연, 2021. “안전의식의 개념 및 측정범위 연구”, 「한국방재학회논문집」, 21(1): 93-100. -
Shin, J.D., Won, J.Y., Kim, M.S., Kim, H.J., Lee, B.J., and Lee, J.S., 2016. “Analyzing the Urban Characteristics for Regional Safety Index Classes: Focused on the Transportation Sector”, Journal of Korea Planning Association, 51(5): 215-231.
[
https://doi.org/10.17208/jkpa.2016.10.51.5.215
]
신진동·원진영·김미선·김현주·이범준·이종설, 2016. “지역안전지수 등급과 시군구 특징 분석: 교통분야를 중심으로”, 「국토계획」, 51(5): 215-231. -
Son, D.P., Cho, Y.J., Han, S.G., and Park, Y.N., 2020a. “An Effectiveness and an Implications for Crime Prevention through Environmental Design”, auri brief, 209: 1-8.
손동필·조영진·한수경·박유나, 2020a. “범죄예방 환경조성 시설·기법의 적용 효과와 시사점”, 「auri brief」, 209: 1-8. -
Son, D.P., Park, Y.N., and Hyeon, T.H., 2020b. “The Analysis of Effectiveness for CPTED Project Using Weighted Displacement Quotient (WDQ)”, Journal of Korea Planning Association, 55(7): 46-55.
[
https://doi.org/10.17208/jkpa.2020.12.55.7.46
]
손동필·박유나·현태환, 2020b. “WDQ를 통한 범죄예방 환경조성 사업의 효과성 분석 연구”, 「국토계획」, 55(7): 46-55. -
Statistics Korea, 2020. 2020 Report on the Social Survey, Daejeon.
통계청, 2020. 「2020년 사회조사보고서」, 대전. -
Yoon, W.S. and Kim, J.H., 2020. “A Study on the Effect of CCTV on Residents’ Perception of Safety: National Data Analysis”, Korean Police Studies Review, 19(4): 87-116.
[
https://doi.org/10.38084/2020.19.4.5
]
윤우석·김주희, 2020. “방범용 CCTV가 체감안전도에 미치는 영향: 전국단위 자료 분석”, 「한국경찰연구」, 19(4): 87-116.